Tridge
Map-Based Food Trade Company Directory
Where food companies find their next trade partner
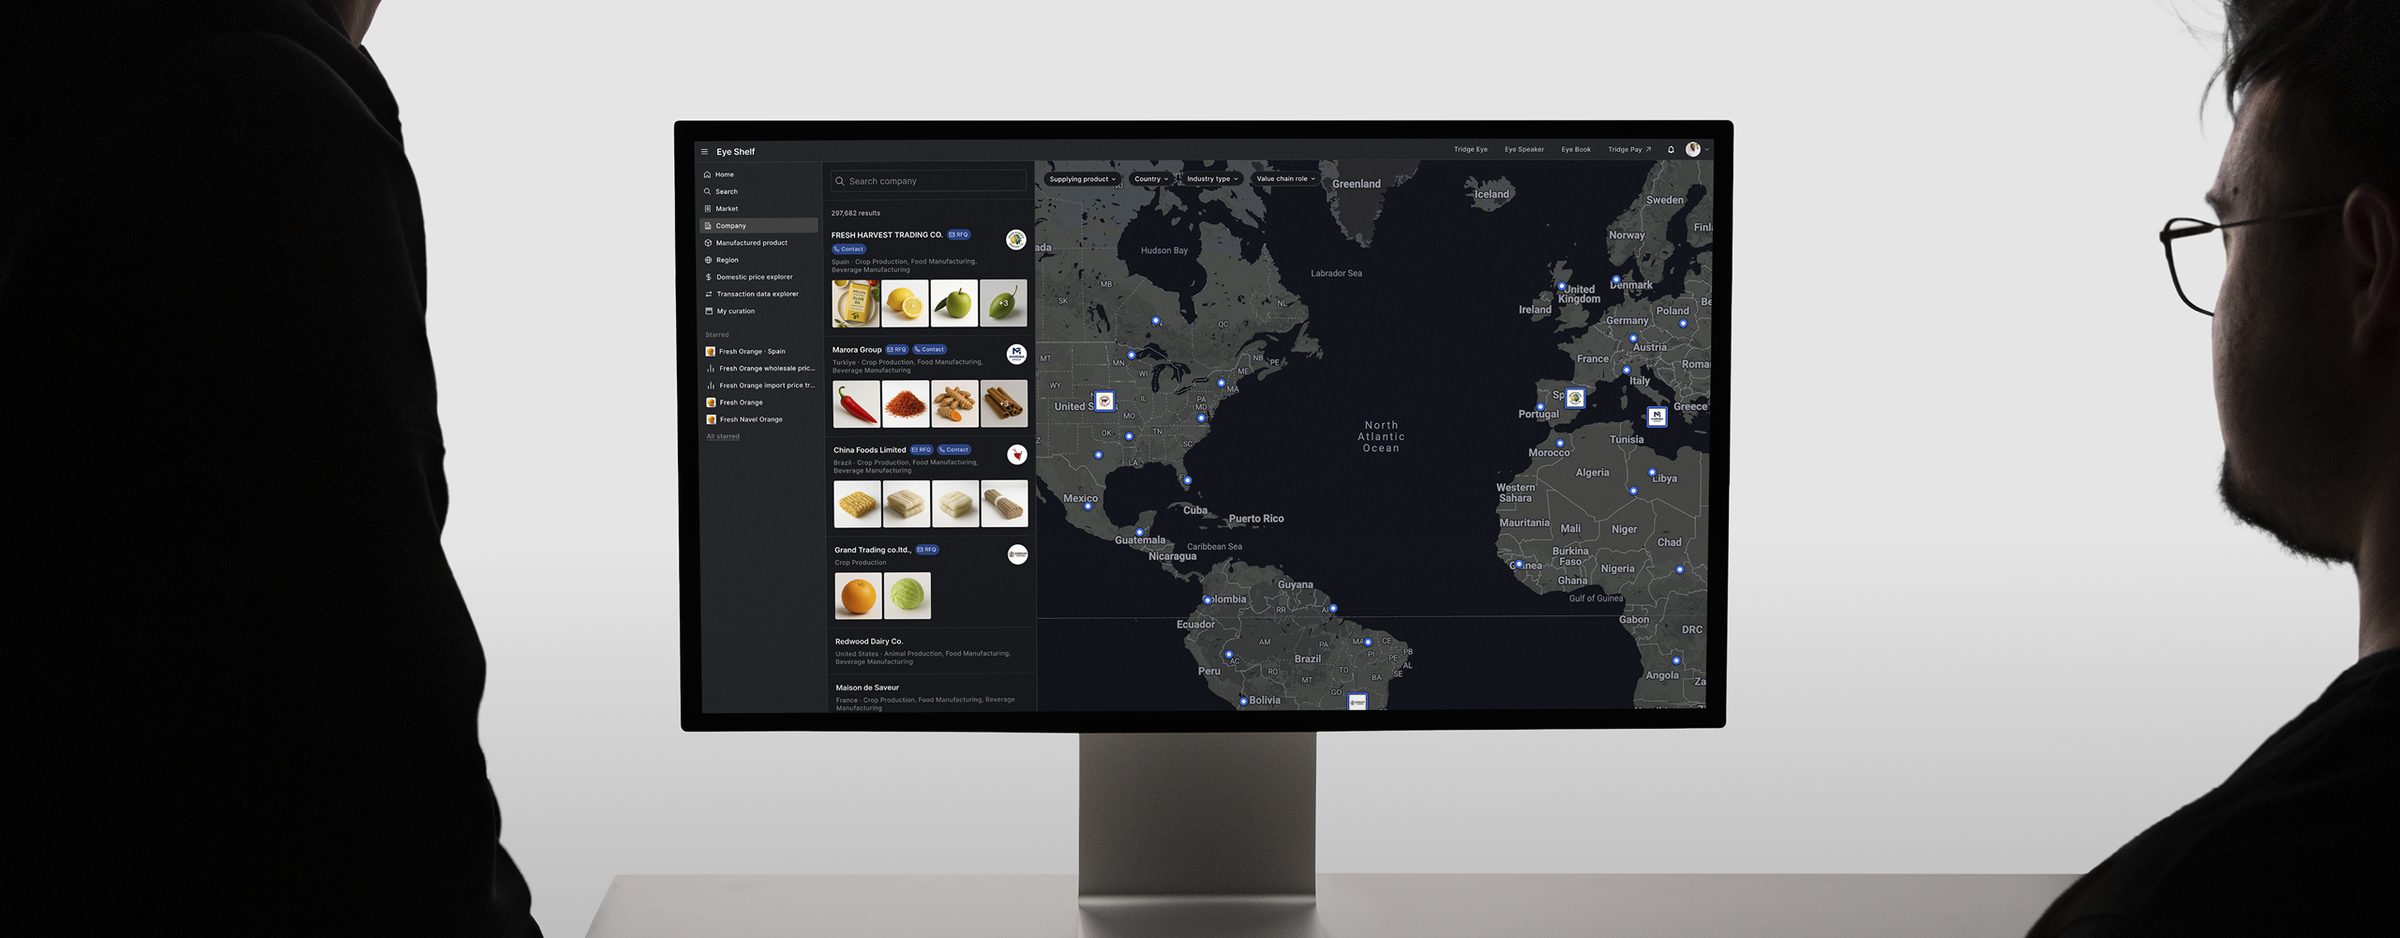
Supplier connections on a B2B agri-trade platform with 1.2M MAU fell to zero in Q1 2025. As the service shifted to an application-centric product, the goal was to keep its core value and get users exploring and contacting companies again.
I redesigned the directory in two iterations, first the company pages and then a map for exploring.
Problem
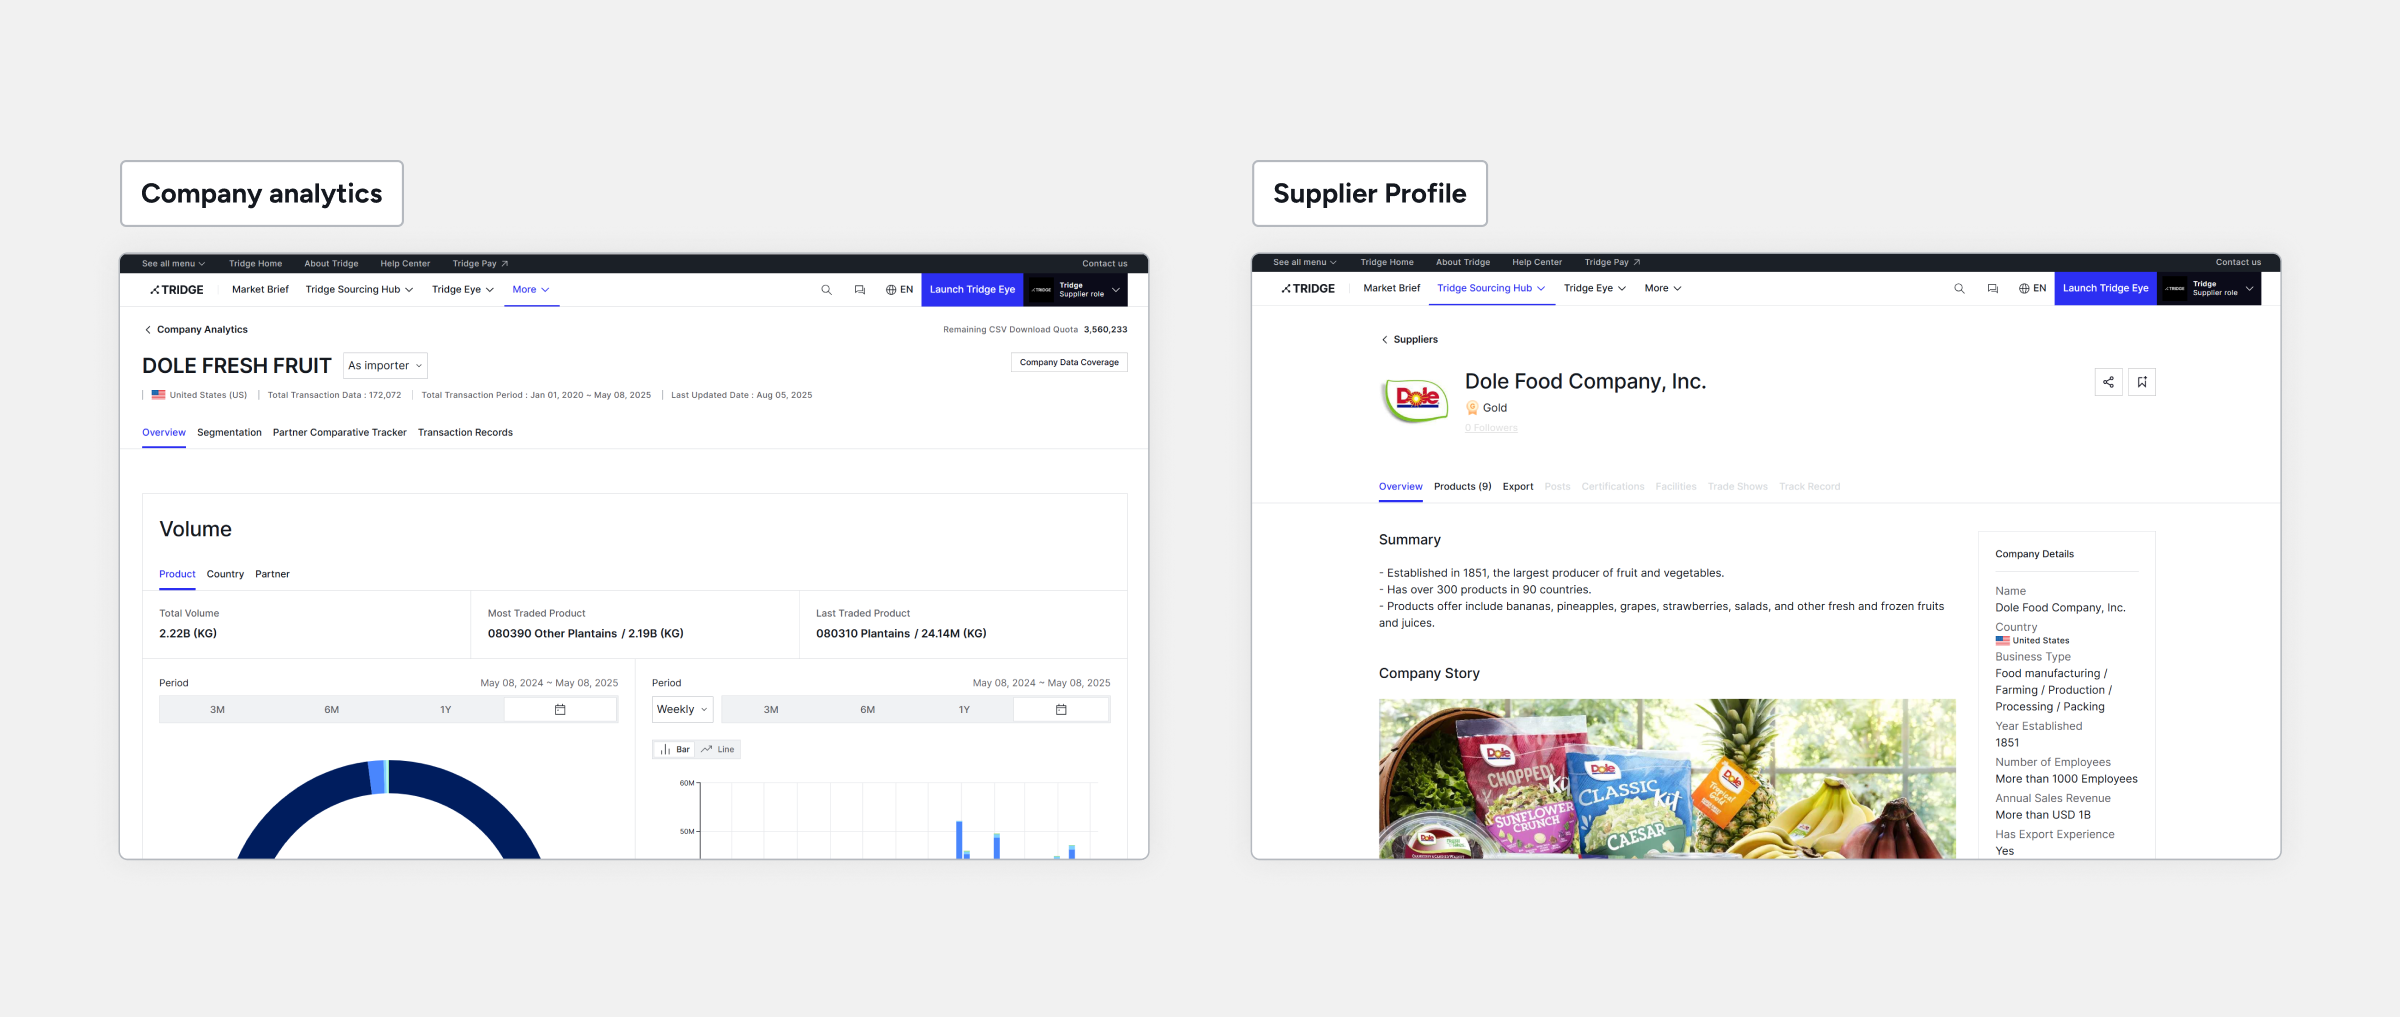
Users found promising companies but rarely took the next step, and profile views and interactions stayed low. Analysis and profiles also sat on separate pages, so a single company was split across two places.
Insight
Traders see a company as one business, not as a buyer or a seller. The trade data showed the same, with most companies both buying and selling.
Solution
I redefined trade as every interaction that leads to a purchase. With the data governance team, we turned that definition into one company model that serves everything from analysis to quote requests.
Before · Two separate company models
After · One unified company model
01
All company information in one place
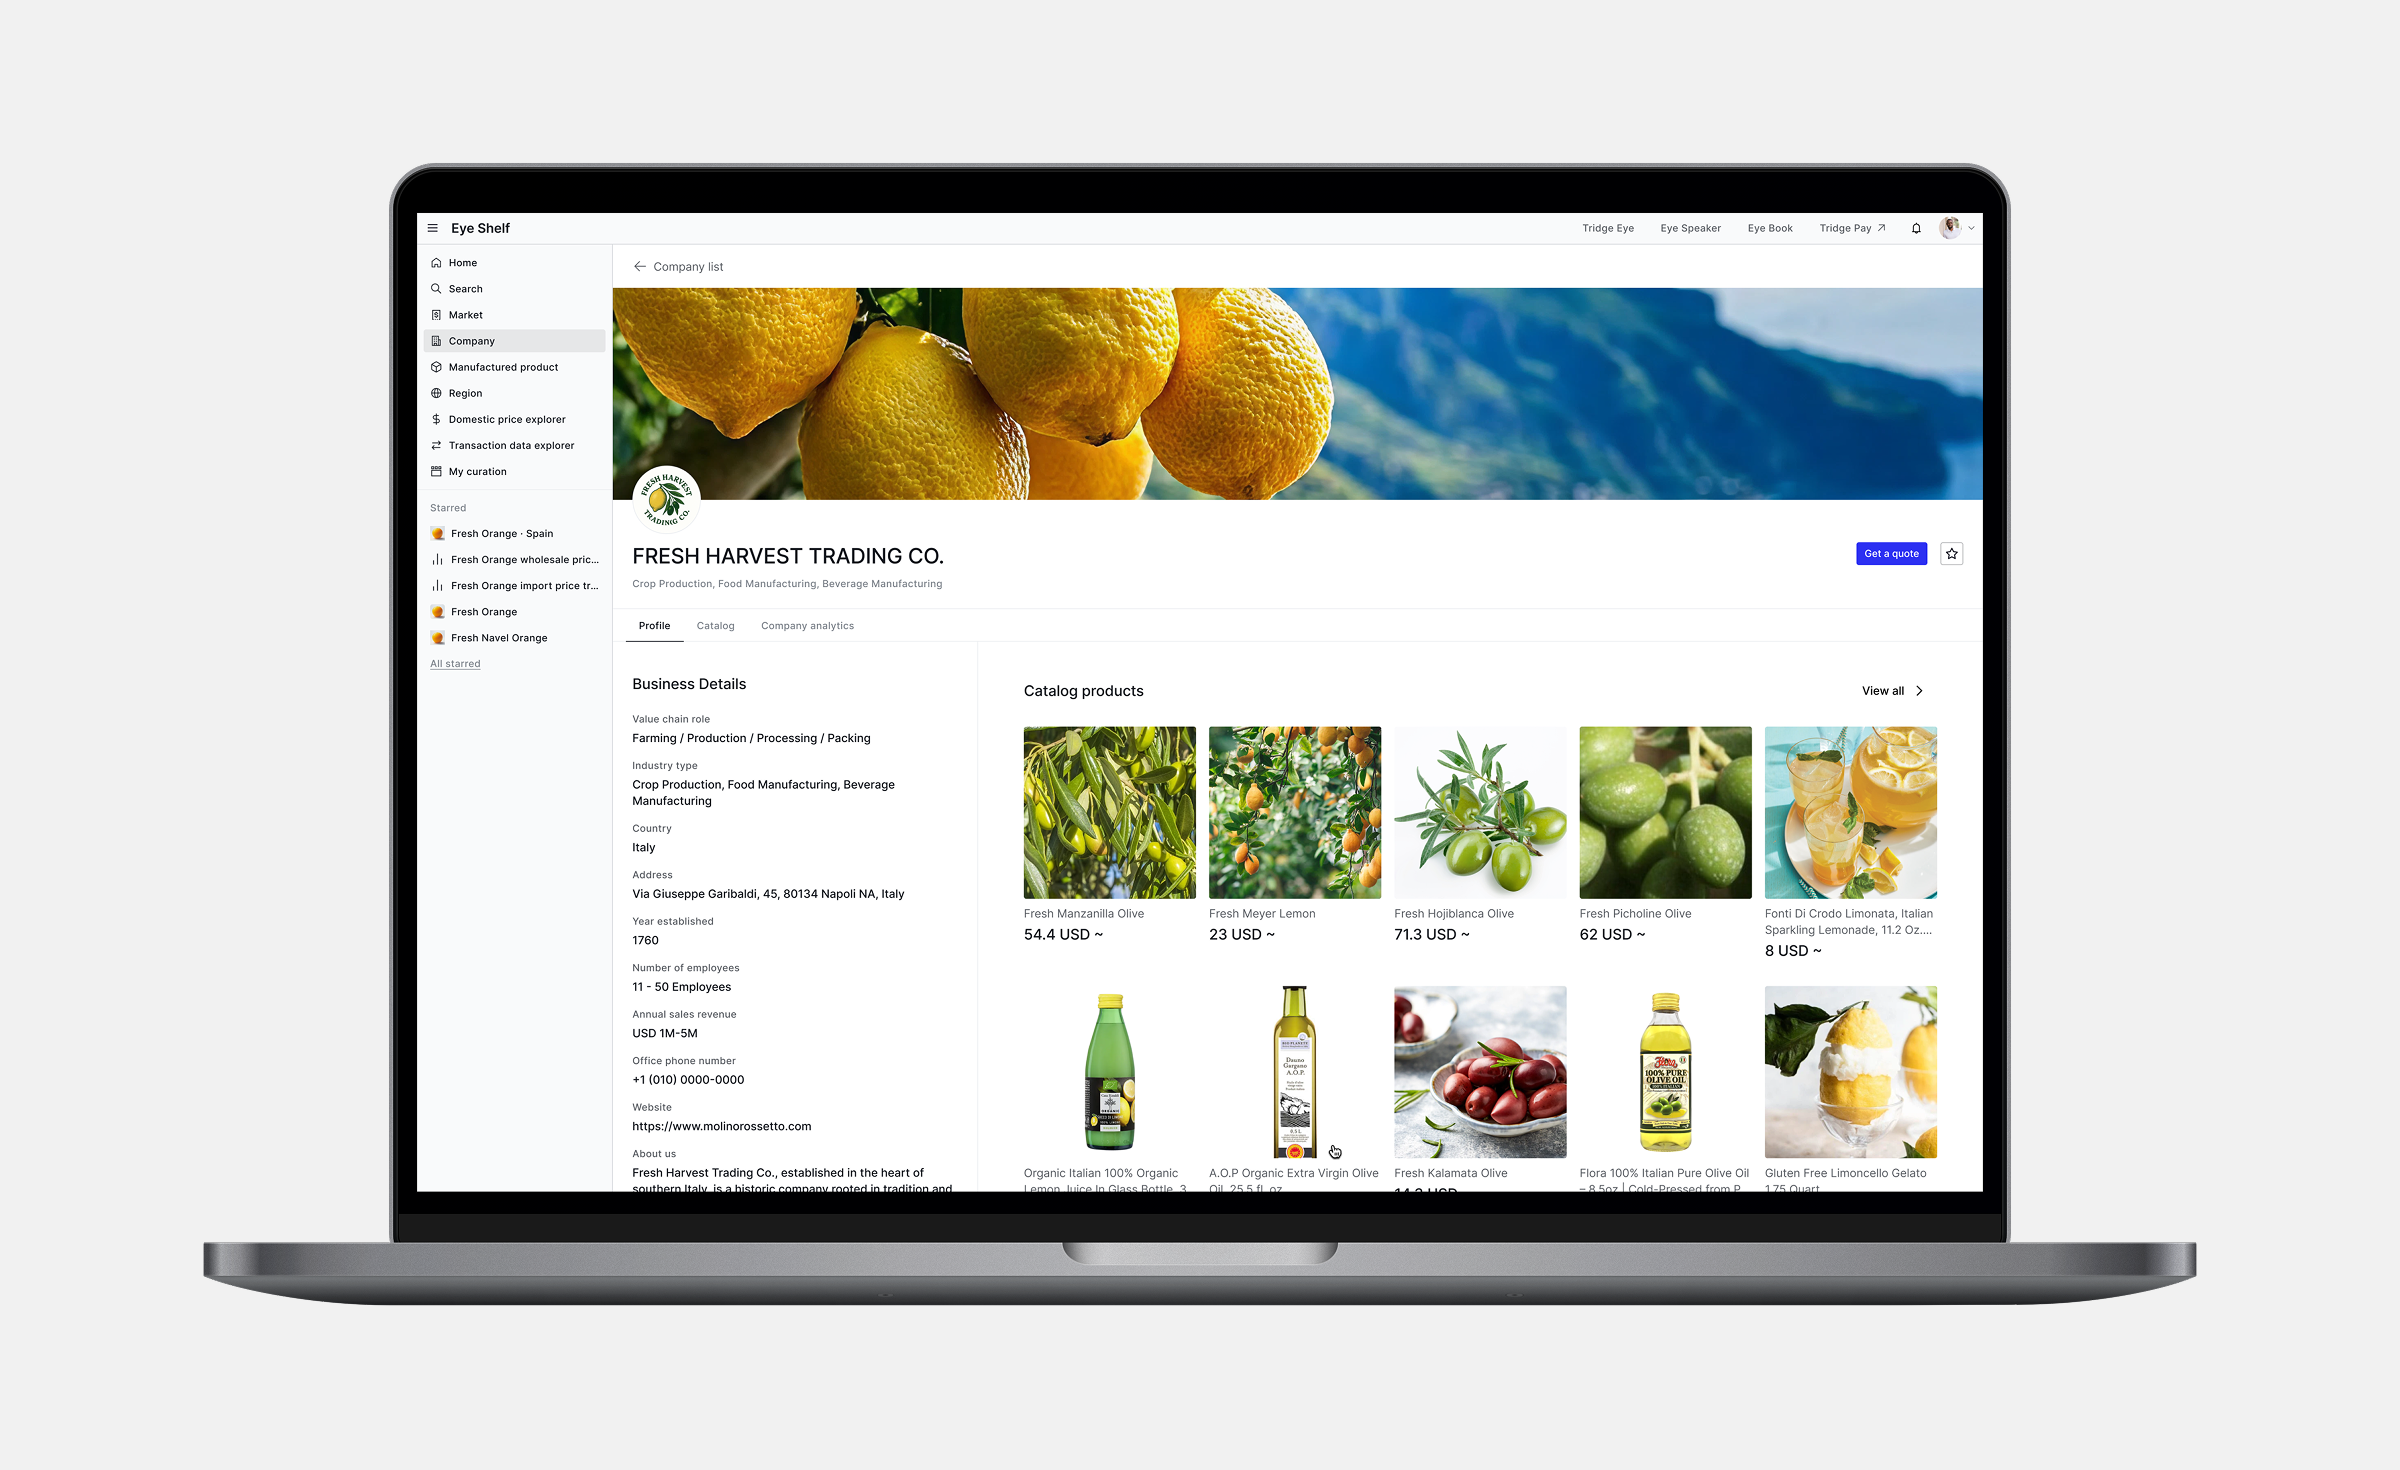
Once trade meant every interaction that leads to a purchase, each company needed a single home. Every company now has one page with its information organised in tabs that can grow as the data grows. Behind the page, each company account stands for one real company and links to a record that AI built from existing data. Because that structure was fixed early, every view of a company could sit under it.
The old profile was built only for suppliers, even though many companies also buy. I rebuilt it as one company profile that works for every company regardless of its role in trade. Trade details come first, while each company's brand story still has room on the page.
Company page
Every view of a company now sits under one page, so users no longer have to jump between two places to understand a single business.
02
From browsing to quoting
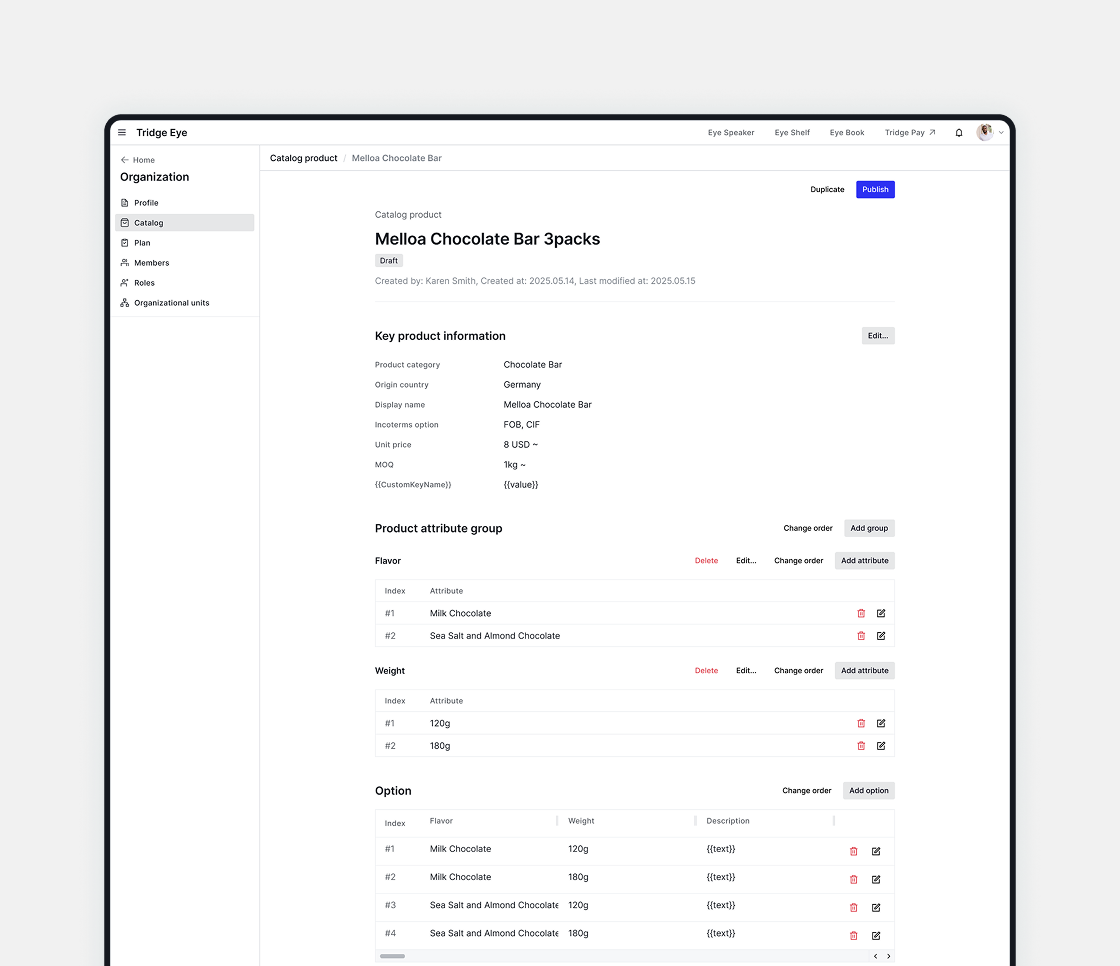
Buyers in trade often ask suppliers for a catalogue first, but the old catalogue was a static page meant only for viewing. Now products listed in the seller centre appear on the company page right next to its trade details. Buyers can request a quote on any product they like, for that specific product rather than a whole category.
Analysis lives on the same page too. I visualised each company's export and import data from overall trade volume down to single records. Users can now read a market and check a partner before they trade.
From catalogue to quote
Products from the seller centre appear on the company page, where buyers can send a quote request for any product they like.
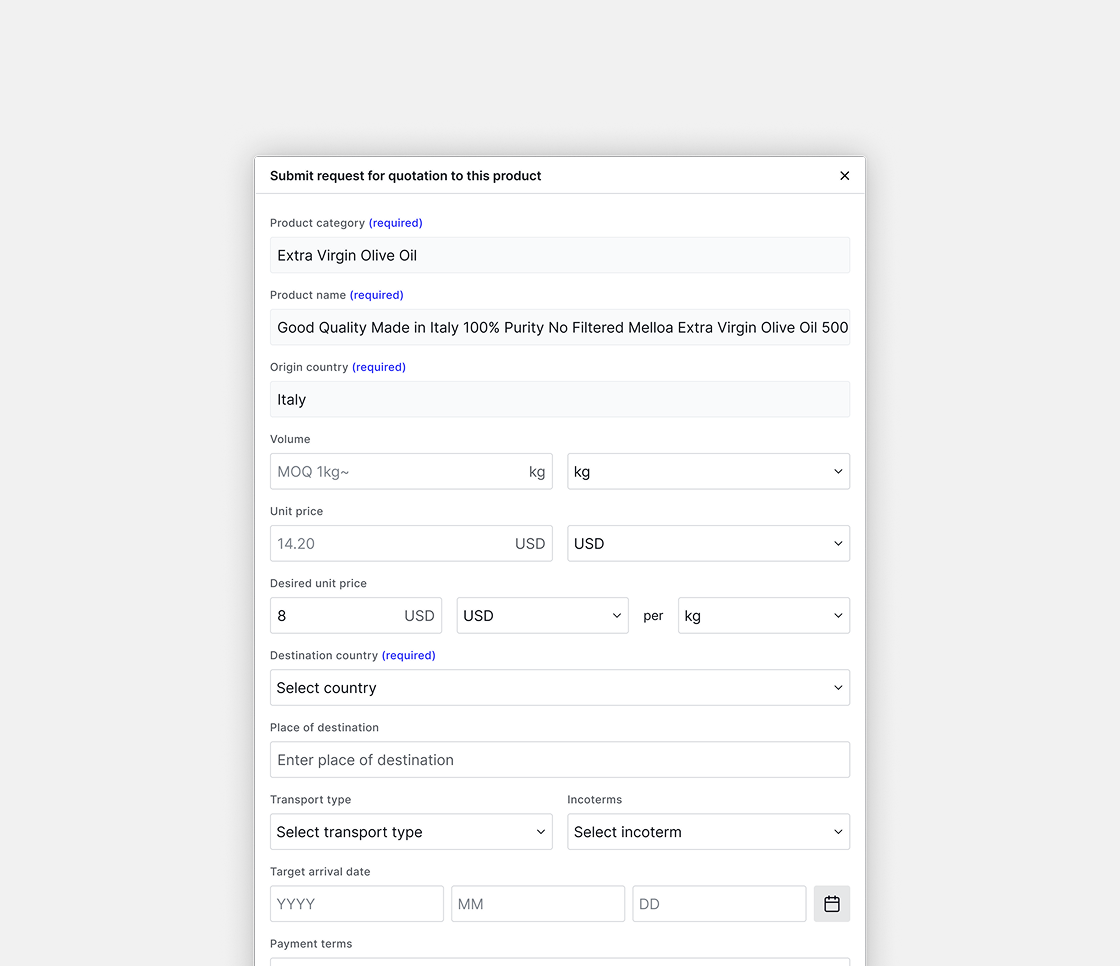
Quotes for a specific product
Before, quotes covered only a product category and drew vague enquiries. Now buyers set the variety, options and trade terms so suppliers can go straight to negotiating.
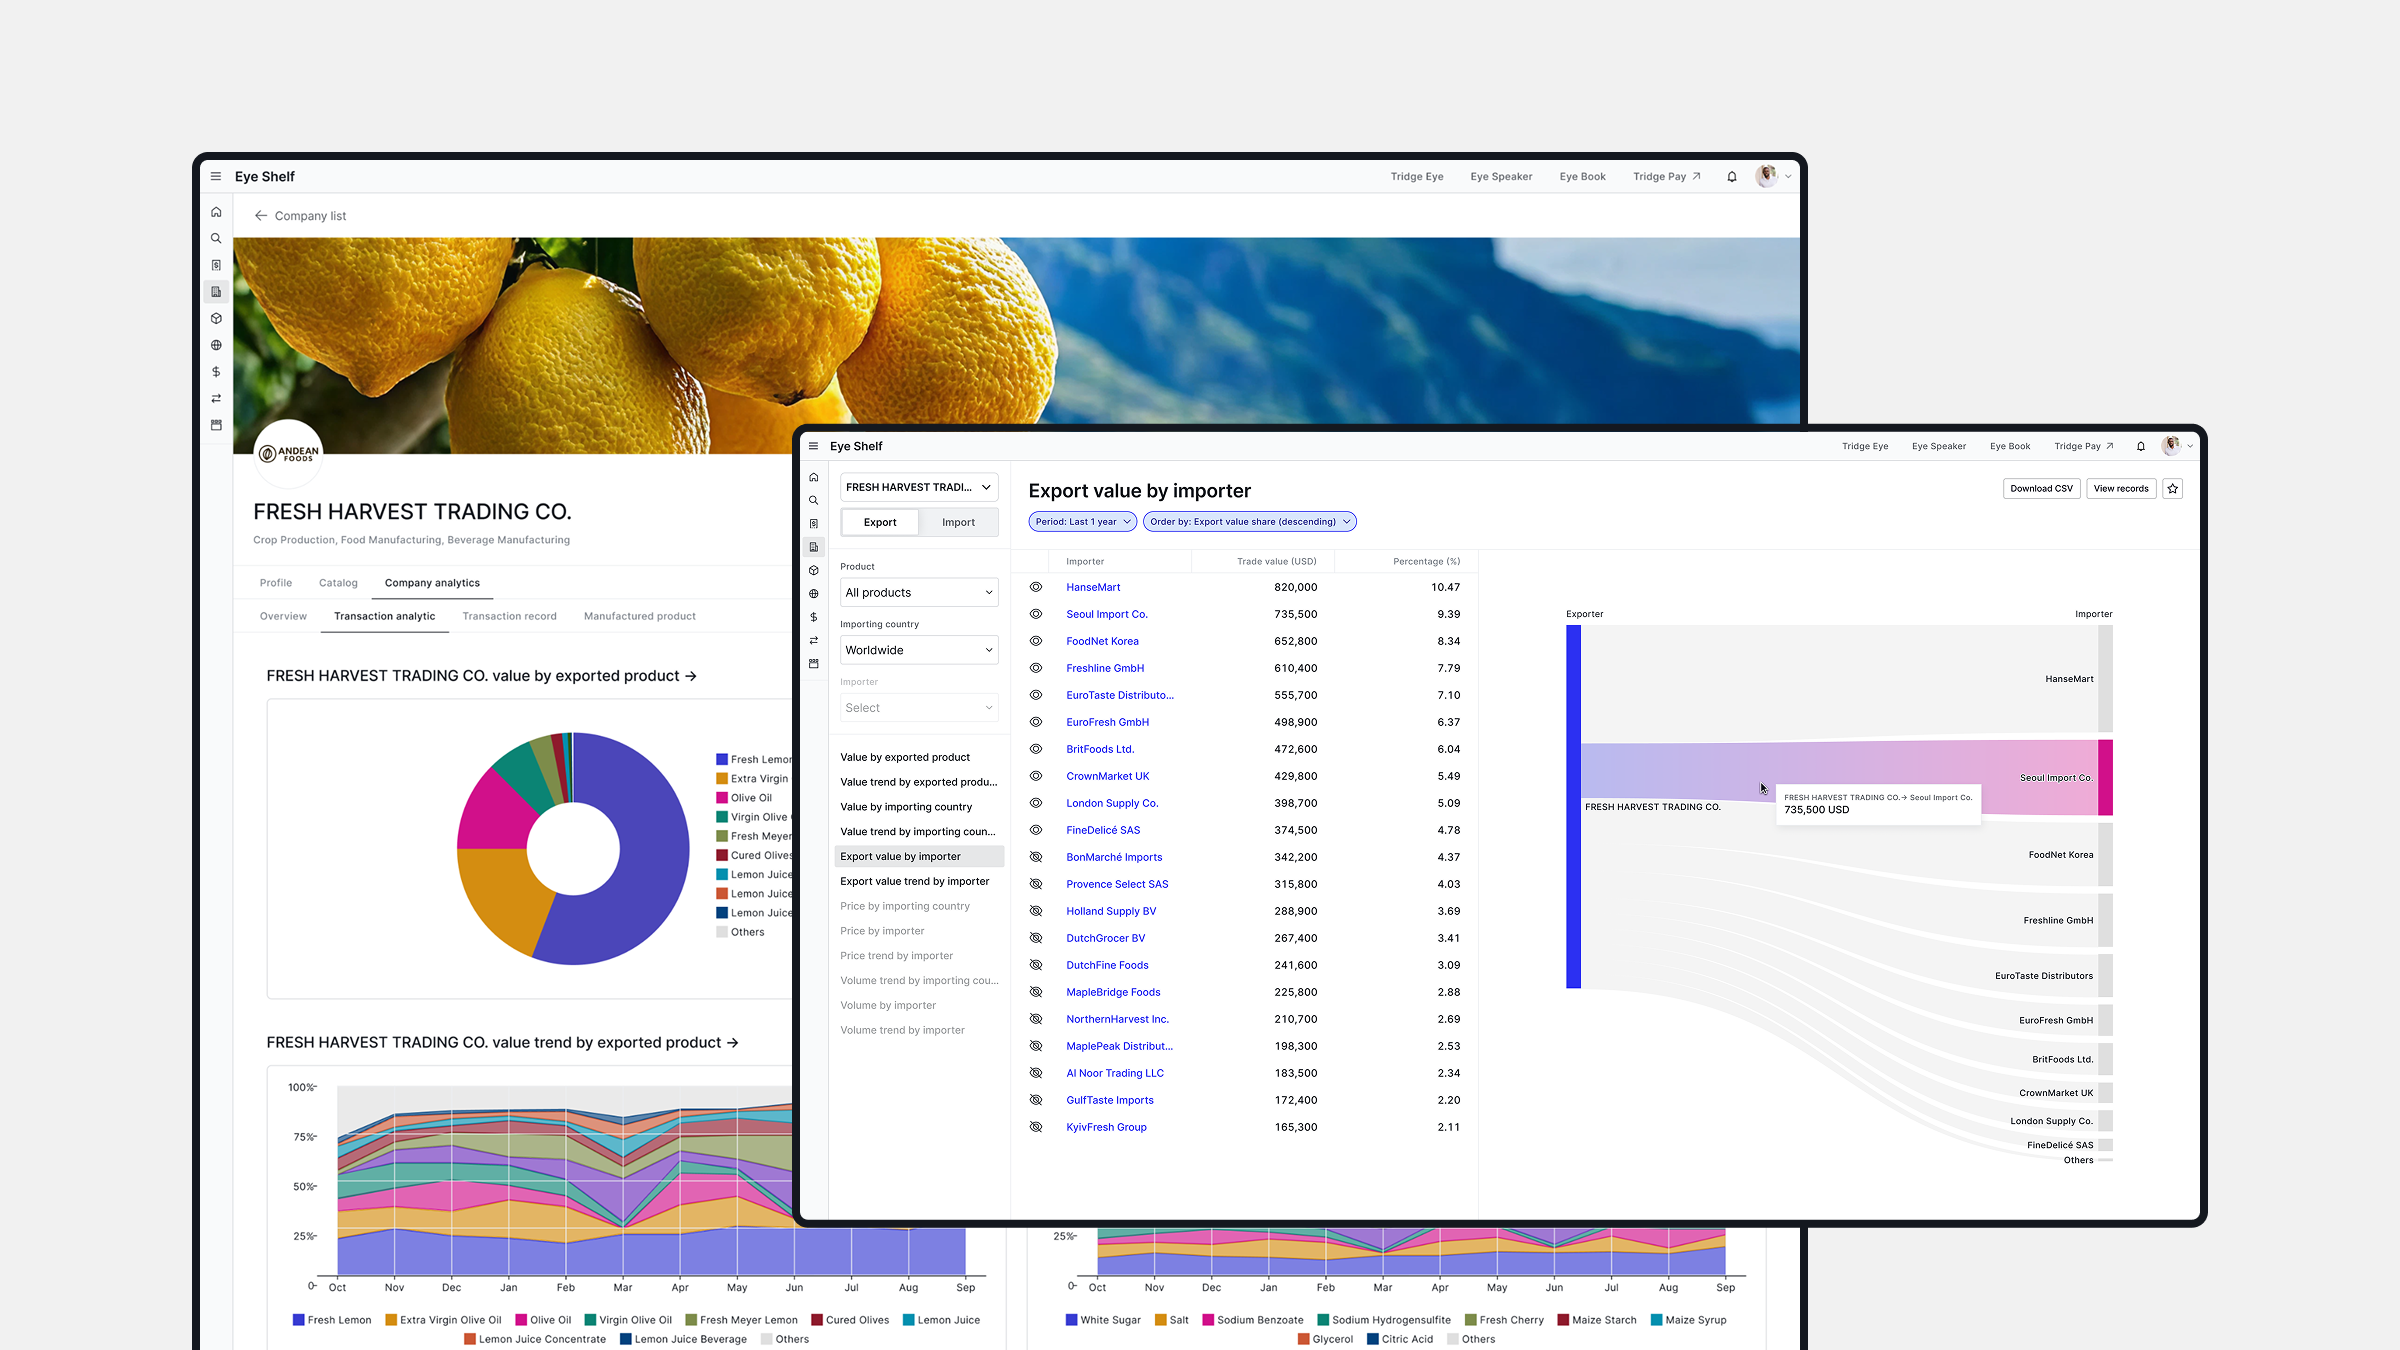
Trade data at a glance
Every company shows its overall trade volume and the partners behind it, which helps users spot new opportunities such as export markets and supply deals.
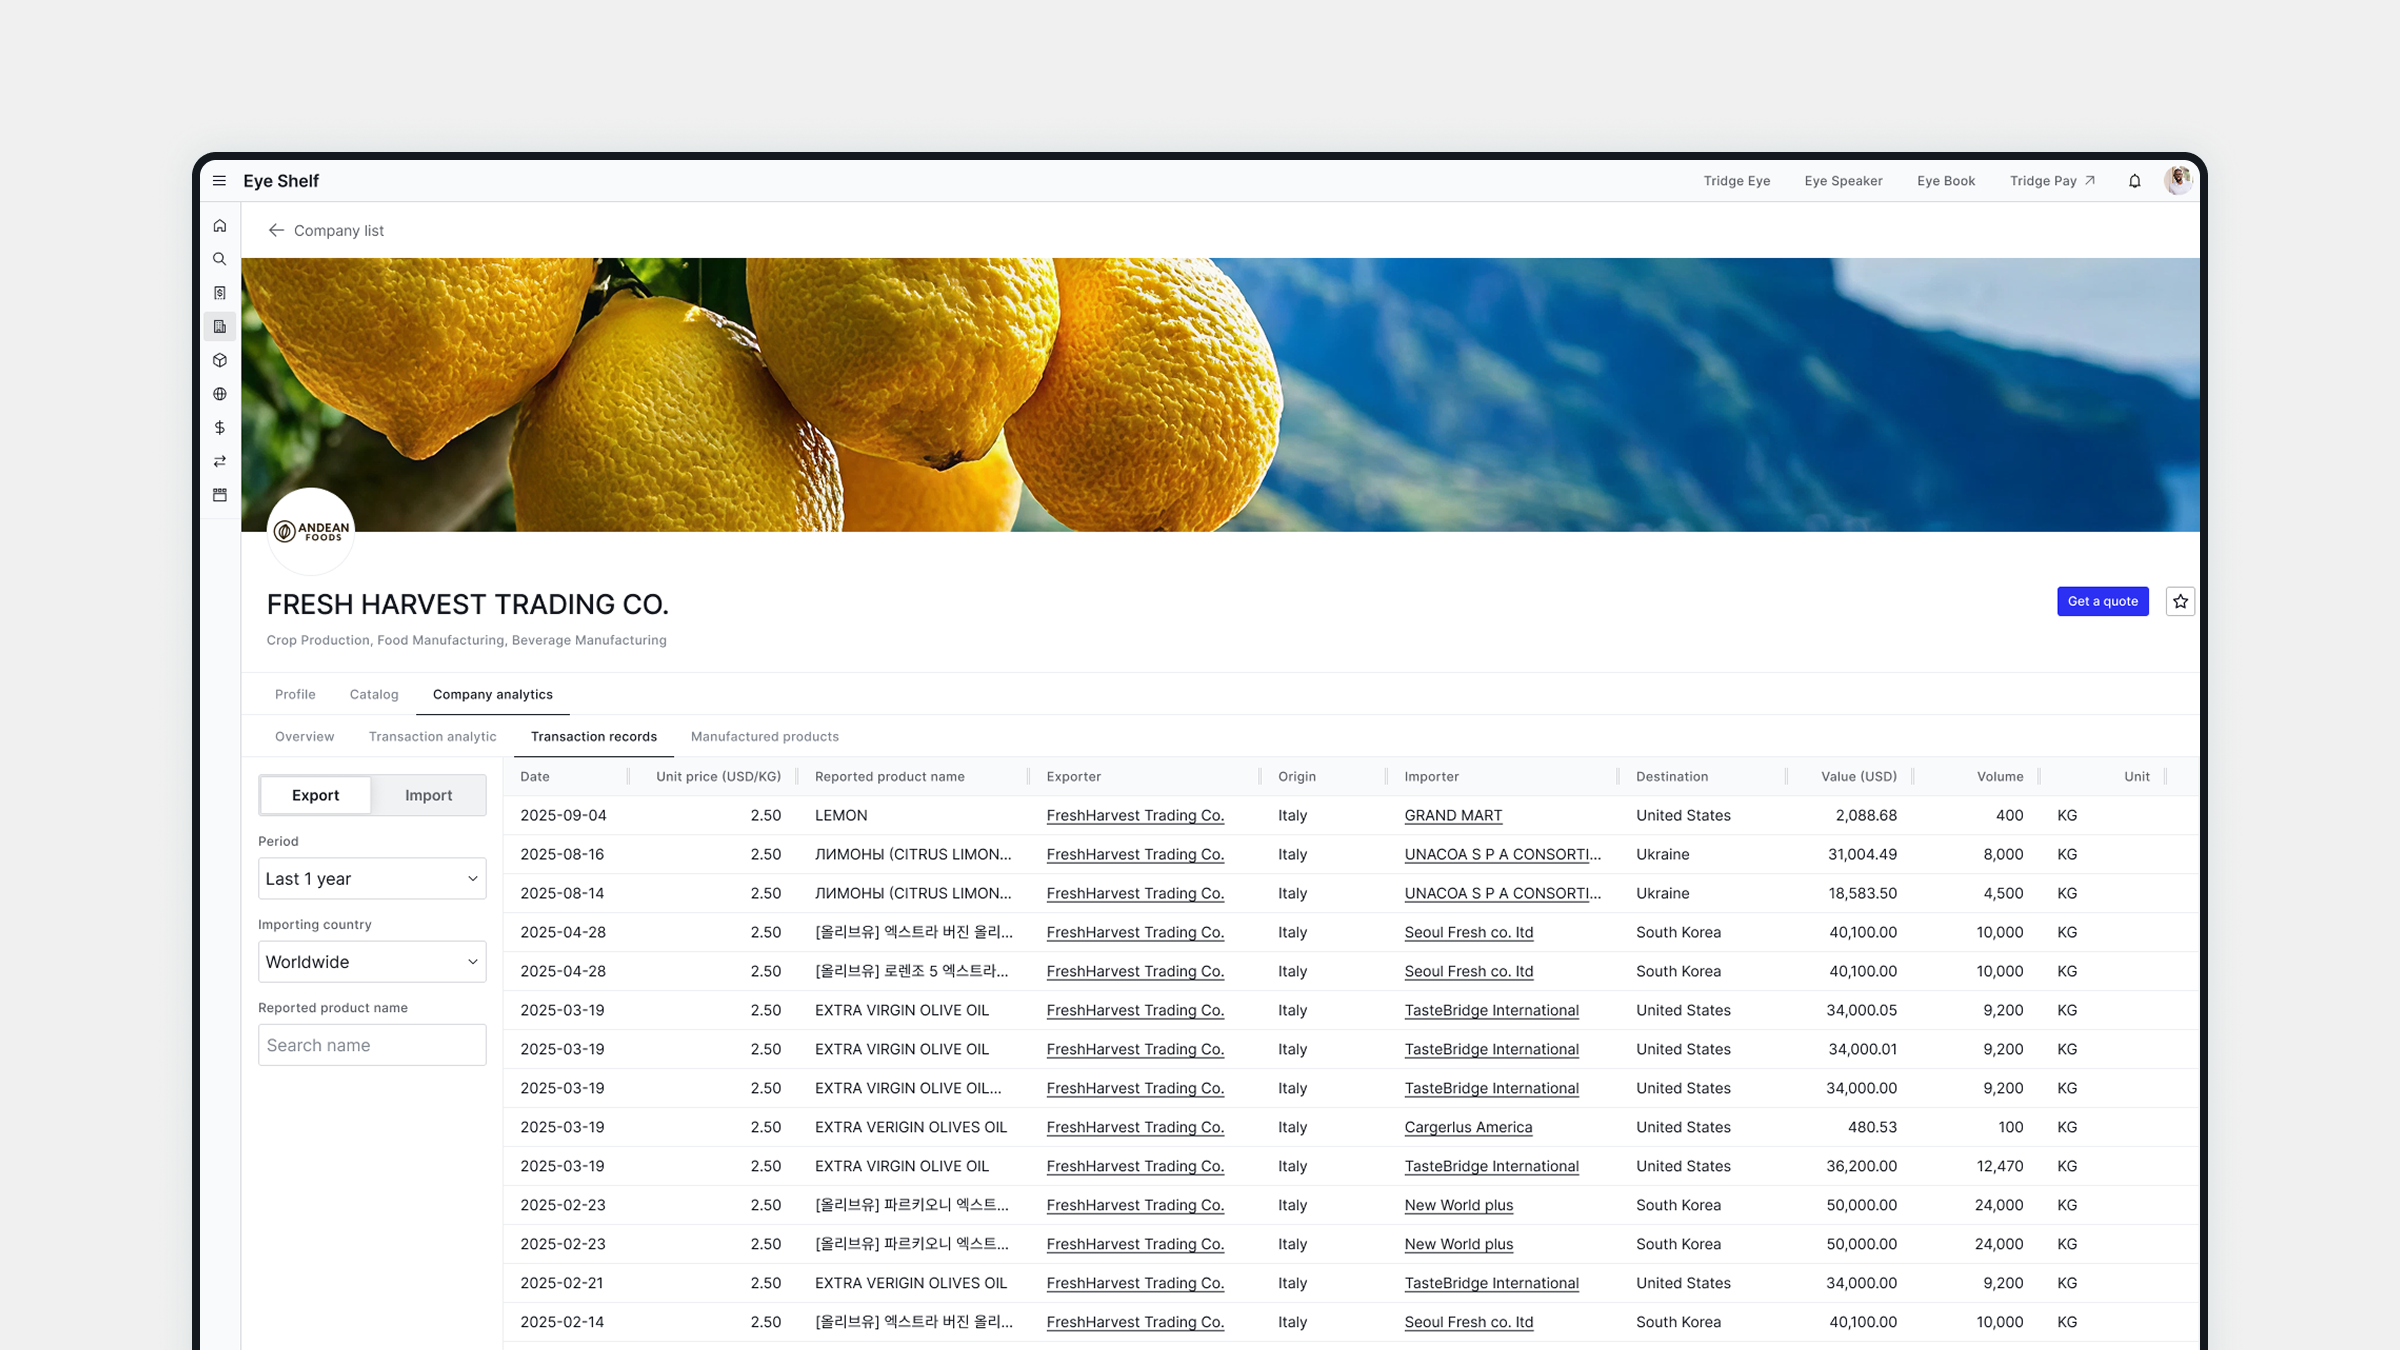
Down to single records
Users can switch between export and import data and scan reported trade records to decide with more confidence before they trade.
03 · 2nd iteration
Finding companies on a map
After the first iteration, users still had to open each profile to see where a company was based. This meant they mostly searched for companies they already knew, and the directory became a place to revisit them rather than to discover new suppliers.
In food trade, the same product differs by origin. Lemons from Amalfi and from Spain vary in quality and price, and distance sets shipping time and cost. That is why location is often the first filter when buyers look for new suppliers. I put every company on a map where the list and the map move together as users explore.
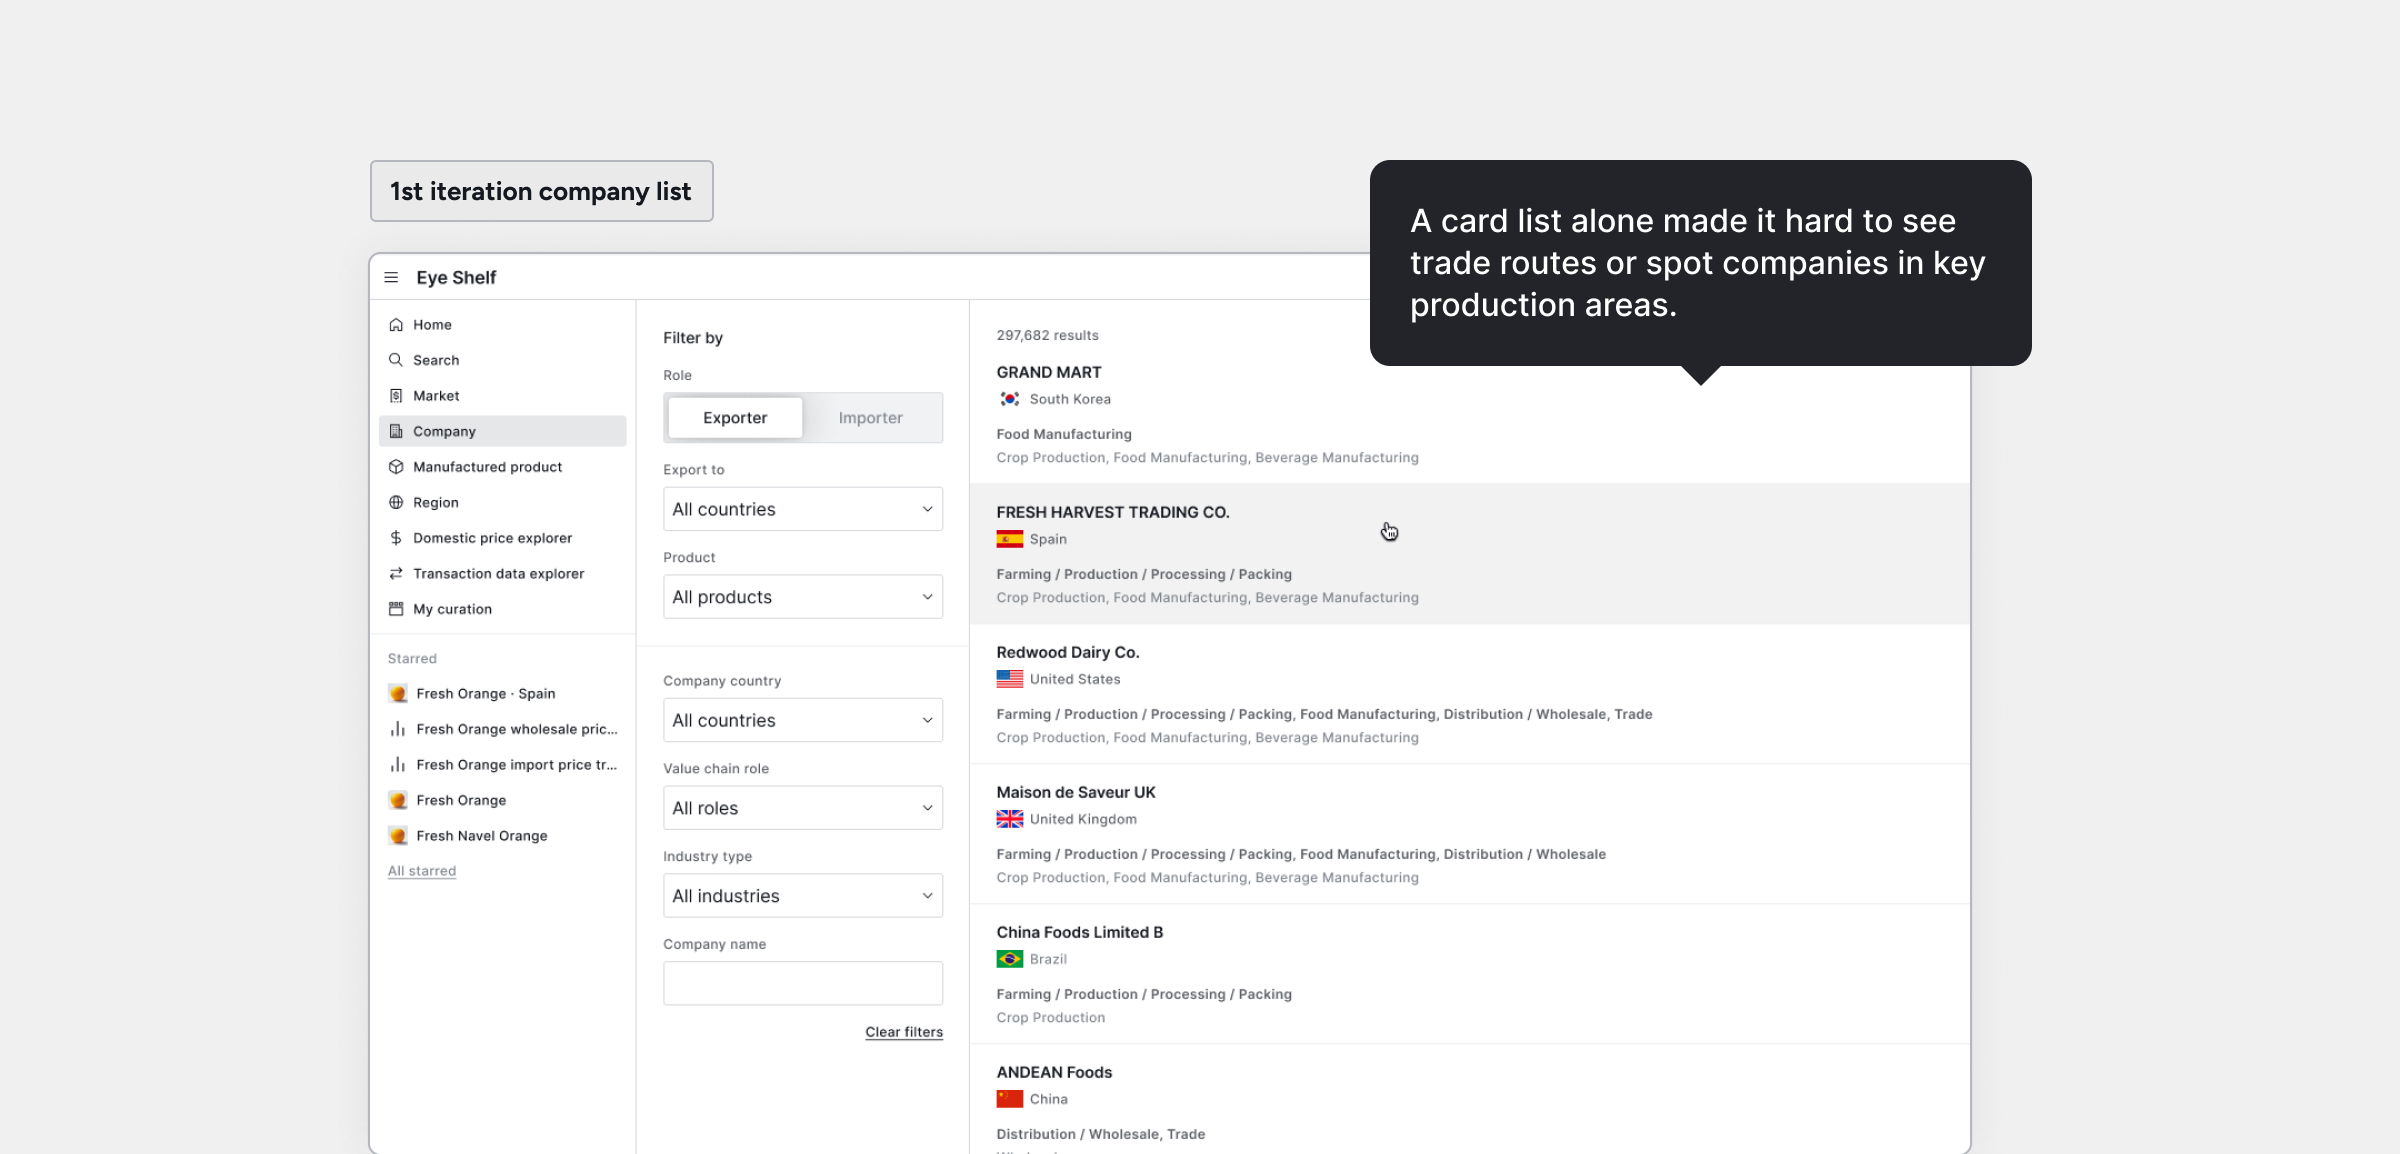
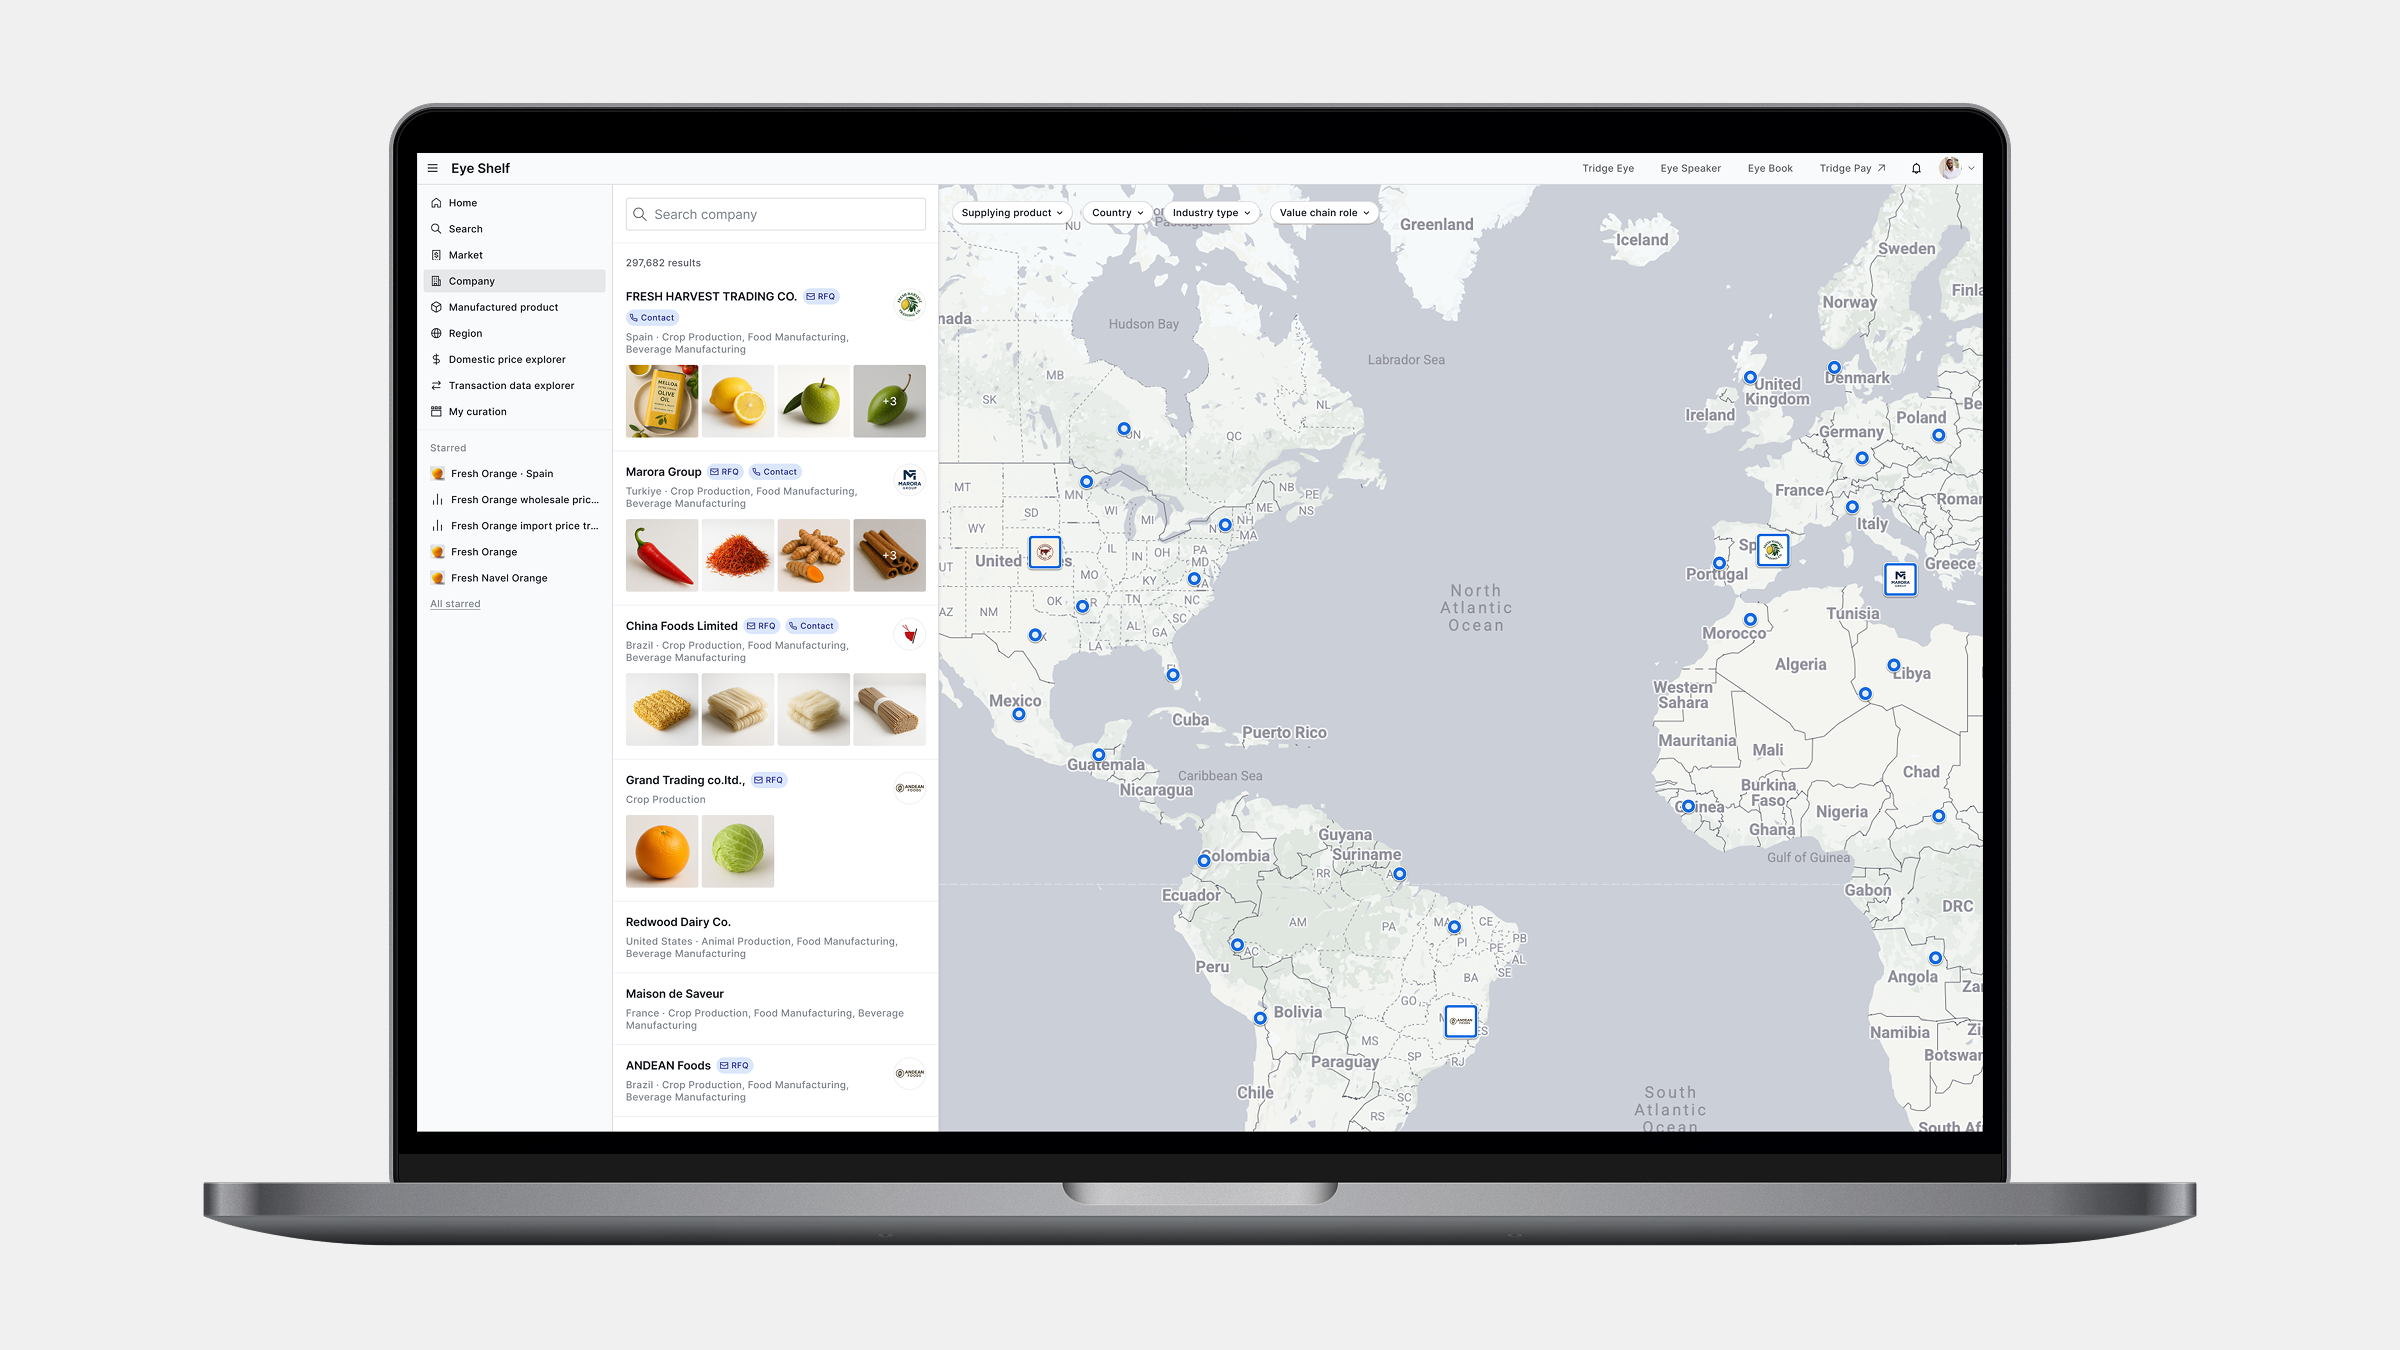
Ranking that rewards complete profiles
With over 150K entries and growing, loading everything at once would overwhelm both users and the system. Ranking brings the most relevant companies to the top, and every detail a company adds moves it further up.
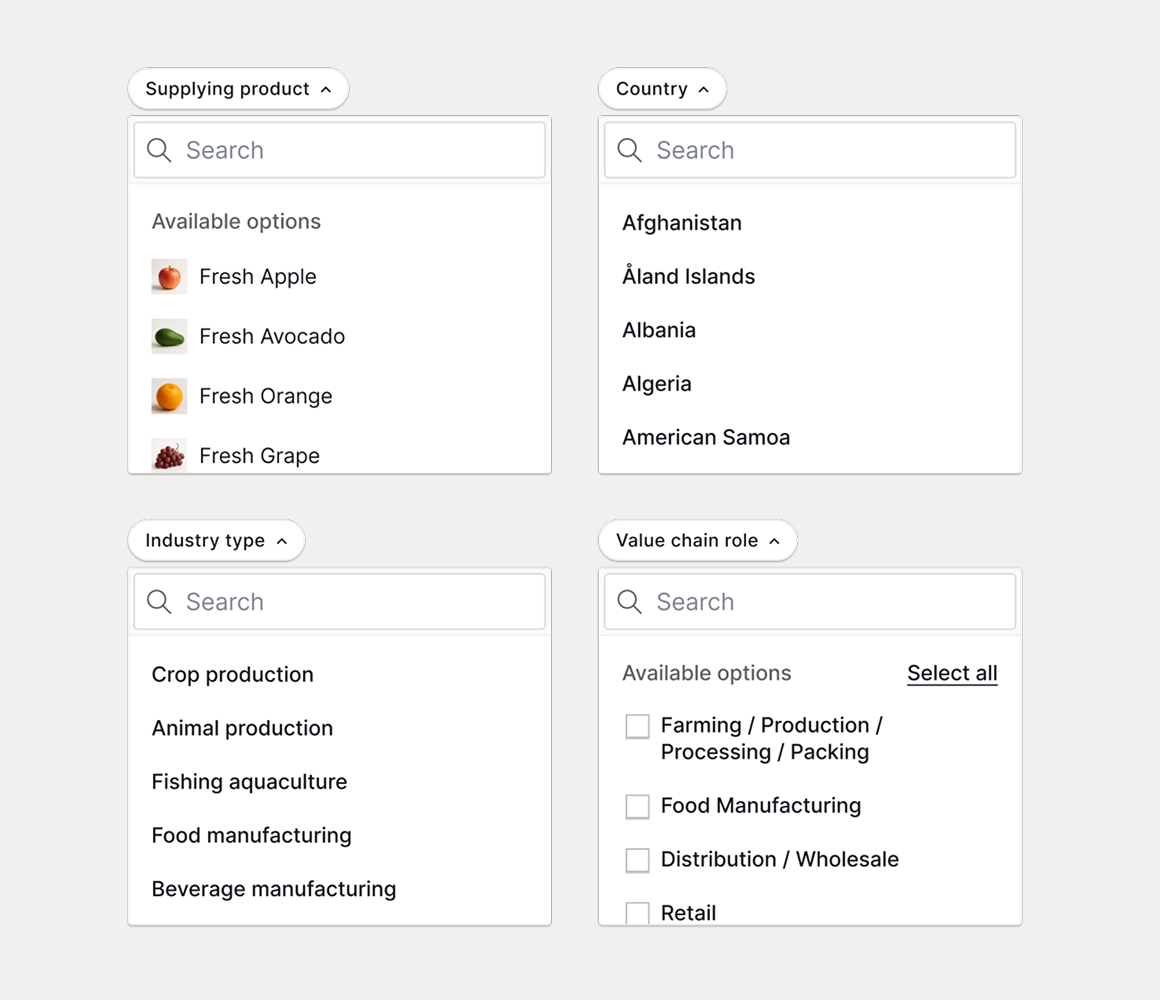
Filters that match how traders search
With over 150K companies in the data, some areas show pins packed tightly together on the map. Filters follow the way traders narrow a search, so users can find relevant companies even when many different kinds share one region.
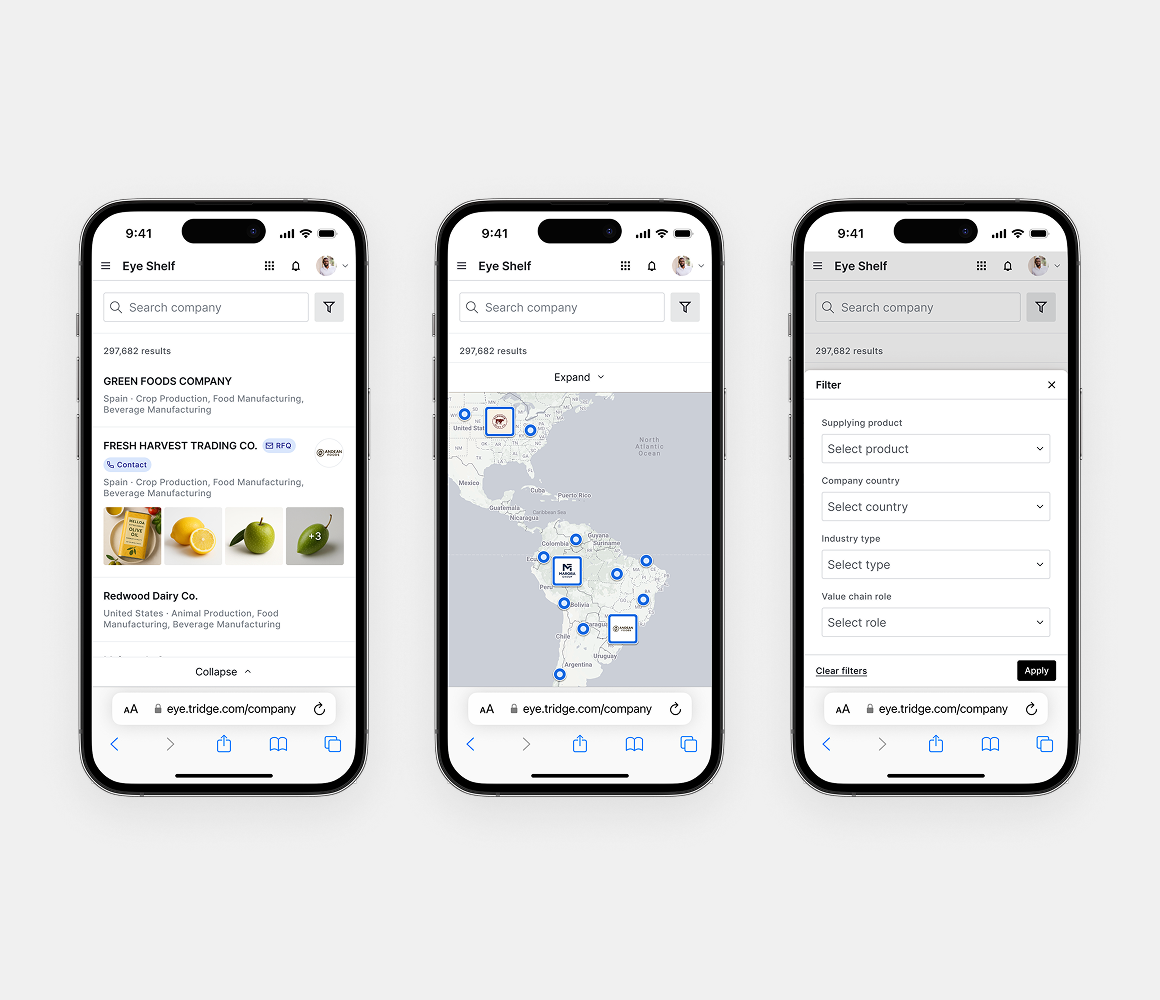
Mobile kept to the essentials
As a work tool, the service was designed web-first. On mobile the list sits over the map and filters open in a modal, which keeps a small screen easy to scan.
Results
Better discovery, stronger engagement
It became the most visited feature in the service. From August to September 2025, profile conversion rose 1.8x. Each active company viewed 146 profiles on average in September, up from 23 in August. 60% of profile views came from browsing the ranked list rather than searching for a name, which suggests users were discovering new companies.
The directory was also part of what the sales team offered in new deals. Clients include Loblaw in Canada and Simplot, a major supplier of McDonald's fries. In South Korea 9 of the top 29 signed on, each a manufacturer with over USD 700M in annual sales. Three of them later renewed after expanding their use of the service.
1.8x
Profile conversion
6.3x
Profiles viewed per active company
60%
Profile views from the ranked list
Aug – Sep 2025, measured in Amplitude

